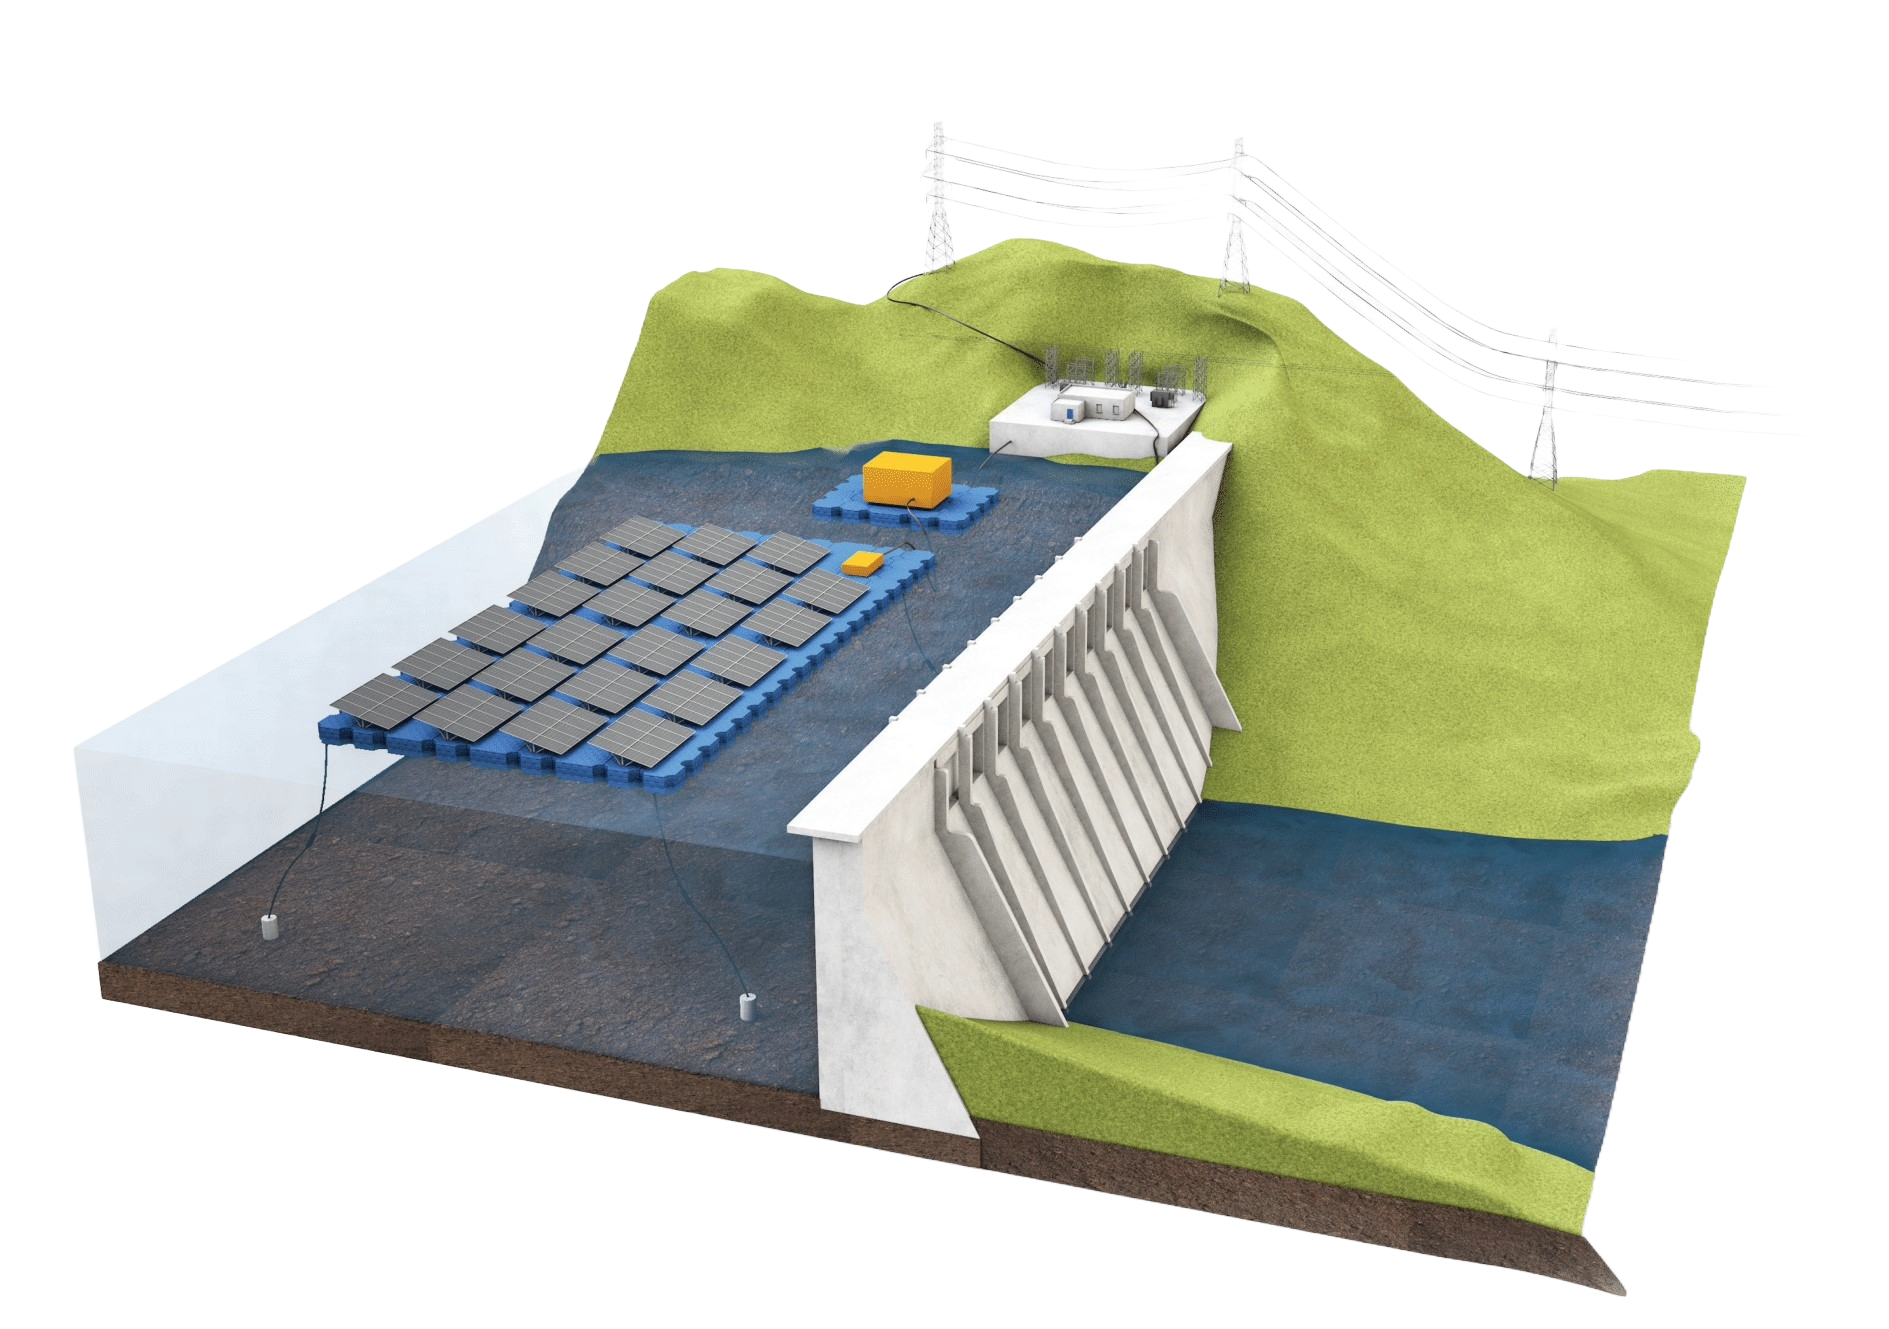

The installation of large-scale floating photovoltaic arrays could impact the energy balance within the ecosystem of a reservoir. By adjusting the levels of incoming solar radiation and effects of wind comparable with areas covered by floating panels, we have tracked how a variety of simulated reservoirs could respond to these kinds of installations. Examining the trends in these aspects of reservoirs can indicate the thresholds that create changes and the nature of those responses.
We have completed a Principal Component Analysis (PCA) analysis that uses a set of parameters in order to identify the modeled reservoir that most accurately represents the environmental changes of the reservoir in question.
WARNING: The modeled reservoir response have been simulated using CE-QUAL-W2, which can be highly sensitive to environmental parameters of the model which were extracted from WorldClim. Additionally, the models have not been validated with the use of real data.

All the reservoirs that meet the criteria listed here are shown. Red markers are reservoirs that have an environmental model, blue do not have a model, and the green one is the selected reservoir. The size of the blue/green points is based on the PCA minimum distance to a modeled reservoir. Note, you can zoom in on the modeled and selected reservoir and see the shape used for the model and selection.
Select a reservoir from the dropdown menu. Reservoir information will be shown as well as information of the model with the smallest PCA. The smaller the PCA, the better the modeled reservoir matches the selected reservoir.
Select a category to plot environmental results:
The mean temperature of all reservoir surface segments within the 60-day window of the season, Jan-Feb (winter) or July-Aug (summer).
The mean outflow temperature across a daily averaged vertical temperature profile of the water body conditions within the 60-day window of the season, Jan-Feb (winter) or July-Aug (summer).